Difference between revisions of "Graph"
From uGFX Wiki
| Line 1: | Line 1: | ||
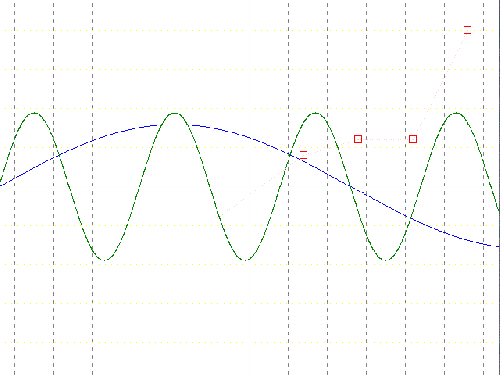
| + | [[File:Graph_demo_640x480.gif|500px|right|Output of the graph demo.]] | ||
The graph window allows to easily draw curves and other sets of data with different colors and shapes in a rectangular window. The graph doesn't take any user input. | The graph window allows to easily draw curves and other sets of data with different colors and shapes in a rectangular window. The graph doesn't take any user input. | ||
Revision as of 06:16, 8 January 2016
The graph window allows to easily draw curves and other sets of data with different colors and shapes in a rectangular window. The graph doesn't take any user input.
Style
The graph window provides an interface to modify the appearance of the graph itself and the data it displays. This contains the following properties:
- Point
- Type (None / Dot / Square / Circle)
- Radius
- Color
- Lines
- Type (None / Solid / Dot / Dash)
- Thickness
- Color
- X-Axis line
- Type (Solid / Dot / Dash)
- Thickness
- Color
- Y-Axis
- Type (Solid / Dot / Dash)
- Thickness
- Color
- X-Axis grid
- Type (Solid / Dot / Dash)
- Thickness
- Color
- Spacing
- Y-Axis grid
- Type (Solid / Dot / Dash)
- Thickness
- Color
- Spacing
- Flags
- Arrows
API reference
The API reference of the graph window can be found here.
Example
The following example creates three curves with different colors and shapes within the same graph widget. Make sure you got the math library included into your build path (-lm).
#include "gfx.h"
#include "math.h"

static const point data[5] = {
	{ -40, -40 },
	{ 70, 40 },
	{ 140, 60 },
	{ 210, 60 },
	{ 280, 200 }
};

static GGraphObject	g;

static GGraphStyle GraphStyle1 = {
	{ GGRAPH_POINT_DOT, 0, Blue },			// point
	{ GGRAPH_LINE_NONE, 2, Gray },			// line
	{ GGRAPH_LINE_SOLID, 0, White },		// x axis
	{ GGRAPH_LINE_SOLID, 0, White },		// y axis
	{ GGRAPH_LINE_DASH, 5, Gray, 50 },		// x grid
	{ GGRAPH_LINE_DOT, 7, Yellow, 50 },		// y grid
	GWIN_GRAPH_STYLE_POSITIVE_AXIS_ARROWS	// flags
};

static const GGraphStyle GraphStyle2 = {
	{ GGRAPH_POINT_SQUARE, 5, Red },		// point
	{ GGRAPH_LINE_DOT, 2, Pink },			// line
	{ GGRAPH_LINE_SOLID, 0, White },		// x axis
	{ GGRAPH_LINE_SOLID, 0, White },		// y axis
	{ GGRAPH_LINE_DASH, 5, Gray, 50 },		// x grid
	{ GGRAPH_LINE_DOT, 7, Yellow, 50 },		// y grid
	GWIN_GRAPH_STYLE_POSITIVE_AXIS_ARROWS	// flags
};

int main(void) {
	GHandle		gh;
	uint16_t 	i;

	gfxInit();

	{
		GWindowInit wi;

		wi.show = TRUE;
		wi.x = wi.y = 0;
		wi.width = gdispGetWidth();
		wi.height = gdispGetHeight();
		gh = gwinGraphCreate(&g, &wi);
	}

	gwinGraphSetOrigin(gh, gwinGetWidth(gh)/2, gwinGetHeight(gh)/2);
	gwinGraphSetStyle(gh, &GraphStyle1);
	gwinGraphDrawAxis(gh);

	for(i = 0; i < gwinGetWidth(gh); i++)
		gwinGraphDrawPoint(gh, i-gwinGetWidth(gh)/2, 80*sin(2*0.2*M_PI*i/180));

	gwinGraphStartSet(gh);
	GraphStyle1.point.color = Green;
	gwinGraphSetStyle(gh, &GraphStyle1);

	for(i = 0; i < gwinGetWidth(gh)*5; i++)
		gwinGraphDrawPoint(gh, i/5-gwinGetWidth(gh)/2, 95*sin(2*0.2*M_PI*i/180));

	gwinGraphStartSet(gh);
	gwinGraphSetStyle(gh, &GraphStyle2);

	gwinGraphDrawPoints(gh, data, sizeof(data)/sizeof(data[0]));

	while(TRUE) {
		gfxSleepMilliseconds(100);
	}
}
